
ASSESSING THE PERFORMANCE OF CLASSIFIER IN MACHINE LEARNING
This blog deals with ASSESSING THE PERFORMANCE OF CLASSIFIER IN MACHINE LEARNING speculating the performance of a classifier using a confusion matrix. It deals with how to use a confusion matrix using scikit-learn – a machine learning library in Python.
A confusion matrix is a performance measurement tool used in the field of machine learning and statistics to evaluate the performance of a classification model. It provides a comprehensive summary of the model’s predictions and the actual outcomes.
For Free, Demo classes Call: 7507414653
Registration Link: Click Here!
The confusion matrix is typically a square matrix with dimensions equal to the number of classes in the classification problem. It consists of four main components:
- True Positives (TP): This represents the number of instances that are correctly predicted as positive or belonging to a particular class.
- True Negatives (TN): This represents the number of instances that are correctly predicted as negative or not belonging to a particular class.
- False Positives (FP): Also known as Type I errors, these are the instances that are incorrectly predicted as positive when they are actually negative.
- False Negatives (FN): Also known as Type II errors, these are the instances that are incorrectly predicted as negative when they are actually positive.
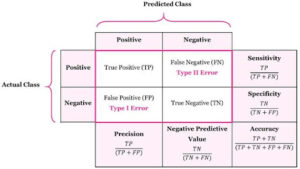
The confusion matrix organizes these components in a tabular format, where the predicted class labels are shown along the columns, and the actual class labels are shown along the rows. Each cell of the matrix represents the count or frequency of instances falling into a particular combination of predicted and actual class labels.
Unlock the potential of Machine Learning classes in Pune. Gain hands-on experience, learn algorithms, and enhance your ML skills.
The confusion matrix provides valuable information for evaluating the performance of a classification model. It enables the calculation of various evaluation metrics such as accuracy, precision, recall (also known as sensitivity or true positive rate), specificity (true negative rate), and F1 score.
By examining the values in the confusion matrix, one can determine the model’s performance in terms of correctly and incorrectly classified instances, identify any patterns or biases in the predictions, and make informed decisions about model improvements or adjustments.
Code:
Let us assume a classifier is built using a machine learning algorithm which predicts whether a transaction is fraud (f) or non-fraud (nf).
For understanding, let us assume we have 11 transactions out of which actual fraud transactions are 4 and non-fraud transactions are 7.
The code given below in Python gives a complete guide on how to check the performance of a classifier using a confusion matrix and associated entities
from sklearn.metrics import confusion_matrix, ConfusionMatrixDisplay, precision_score, recall_score, accuracy_score, f1_score
import matplotlib.pyplot as plt
# True labels
y_true = [“f”, “f”, “f”, “f”, “nf”, “nf”, “nf”, “nf”, “nf”, “nf”, “nf”]
# Predicted labels
y_pred = [“f”, “f”, “f”, “nf”, “nf”, “nf”, “nf”, “nf”, “nf”, “f”, “f”]
# Calculate the confusion matrix
cm = confusion_matrix(y_true, y_pred, labels=[“f”, “nf”])
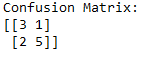
print(“Confusion Matrix:”)
print(cm)
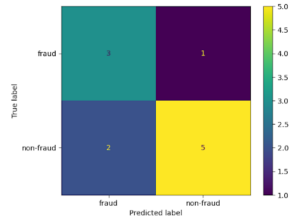
disp = ConfusionMatrixDisplay(confusion_matrix=cm, display_labels=[“f”, “nf”])
disp.plot()
plt.show()
# Calculate precision
precision = precision_score(y_true, y_pred, pos_label=”f”)
precision = round(precision, 2)
print(“Precision:”, precision)
# Calculate recall
recall = recall_score(y_true, y_pred, pos_label=”f”)
recall = round(recall, 2)
print(“Recall:”, recall)
# Calculate accuracy
accuracy = accuracy_score(y_true, y_pred)
accuracy = round(accuracy, 2)
print(“Accuracy:”, accuracy)
# Calculate F1 score
f1 = f1_score(y_true, y_pred, pos_label=”f”)
f1 = round(f1, 2)
print(“F1 Score:”, f1)
Output:
For Free, Demo classes Call: 7507414653
Registration Link: Click Here!
Analysis based on the output:
To evaluate the performance of a classification model based on the provided confusion matrix and calculated metrics, we can make the following comments:
- Confusion Matrix: The confusion matrix shows the distribution of predicted and actual class labels. In this case, we have a 2×2 confusion matrix with labels “f” and “nf”. The matrix reveals that there are 3 true positives (TP), 1 false positive (FP), 2 false negatives (FN), and 5 true negatives (TN).
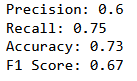
- Precision: The precision score indicates the proportion of correctly predicted positive instances (class “f”) out of all instances predicted as positive. In this scenario, the precision is 0.75, which means that when the model predicts an instance as “f”, it is correct 75% of the time.
- Recall: The recall score represents the proportion of correctly predicted positive instances (class “f”) out of all actual positive instances. The recall is also 0.75 in this case, indicating that the model can identify 75% of the actual positive instances.
- Accuracy: The accuracy score reflects the overall correctness of the model’s predictions. Here, the accuracy is 0.73, implying that the model predicts the correct class for approximately 73% of the instances.
- F1 Score: The F1 score is the harmonic mean of precision and recall, providing a balanced measure of the model’s performance. In this example, the F1 score is 0.75, which indicates a reasonably balanced trade-off between precision and recall.
For Free, Demo classes Call: 7507414653
Registration Link: Click Here!
Based on these metrics, we can conclude that the model performs reasonably well in terms of precision, recall, accuracy, and F1 score. However, a more comprehensive evaluation, such as comparing the results to a baseline or considering the specific requirements of the application, would be necessary to assess the model’s performance in a broader context.
Are you eager to delve into the fascinating world of machine learning? Do you want to gain the skills and knowledge required to build intelligent systems and unlock the potential of data-driven decision-making? Look no further! Our Machine Learning Training in Pune is designed to empower you with the expertise to thrive in this rapidly growing field.
Do Watch our Latest Video: Click Here
Call now!!! | SevenMentor Pvt Ltd.
© Copyright 2021 | SevenMentor Pvt Ltd.