

Can Remdesivir Prove To Be Superior To Placebo??— A Statistical Understanding
Let’s see statistically why Remdesivir Injection proved to be so effective during the second wave. In India we have encountered the deadly second wave, We as a generation have not seen anything like that before but Medical Science and people related to Medical Science had not left any stone unturned.
Firstly I want to use this blog as a medium to thanks all the frontline workers, all the doctors, nurses, social workers etc.
Thank You So much for putting your life in risk to save ours –
We all have heard about the Remdesivir Injection, we all have seen the shortage of this injection in our country, this made me curious to know “Why Remdesivir proved to be so effective, What statistical tests were performed on the people?” While Researching about the Remdesivir Injection, i found a very interesting paper published in National Library of Medicine and this was the final report on this injection by the National Institute of Allergy and Infectious Diseases.
I have posted the link of this final report.
Remdesivir for the Treatment of Covid-19 – Final Report – PubMed
Our data show that Remdesivir was superior to placebo in shortening the time to recovery in adults who were… pubmed.ncbi.nlm.nih.gov
So Let’s discuss in detail what they have exactly done.
For Free, Demo classes Call: 8983120543
Registration Link: Click Here!
Objective –
Can Remdesivir prove to be superior to placebo in shortening the time to recovery in adults who were hospitalized with Covid-19 and had evidence of lower respiratory tract infection??
Before going ahead, lets discuss what is placebo
Initially they randomly choose 1082 patients obviously with their consent to perform certain tests, let me describe the simple test to you.
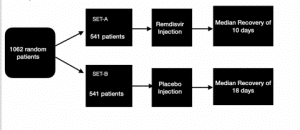
From the above table, you can see that there are in total 1082 patients, firstly we divided these people into 2 sets.
SET-A HAS 541 PATIENTS WHICH WERE GIVEN REMDISVIR INJECTIONS
SET-B HAS 541 PATIENTS WHICH WERE GIVEN PLACEBO INJECTIONS.
Before going down, placebo injections are simple injection filled with water so those patients thinks that they had been given medicine. It is just to create a physiological comfort to patients.
Now for each 541 patients in both the sets, their recovery time has been observed.
Xr(Random variable which consists of recovery time of the patients belongs to SET-A or people who were give Remdesivir)
Yp(Random variable which consists of recovery time of the patients belongs to SET-B or people who were give placebo)
Xr=[x1,x2,x3,x4,x5………….x541]
Here x1 is the recovery time taken by patient 1, x2 is the recovery time taken by patient 2, and so on… For example- If patient1 from Set-A took 6 days to recover, then x1 is 6, if patient2 from set-A took 9 days to recover, then x2 is 7.
Unfortunately there will be people who never recovered or died, so for them xi will be infinite. Also x1, x2 are the patients which were given Remdesivir.
Yp=[y1,y2,y3,y4………………y541]
Here y1 is the recovery time taken by patient 1, y2 is the recovery time taken by patient 2 and so on… For example- If patient1 from Set-B took 16 days to recover, then y1 is 16, if patient2 from set-B took 19 days to recover, then y2 is 19.
Now we will be taking median for all the values in Xr and we will be taking median for all the values in Yp to understand the central tendency of the distribution or in common terms it will tell what is the average time of recovery in both the sets.
For Free, Demo classes Call: 8983120543
Registration Link: Click Here!
One question would be that why are we not taking means to get the average?
Now for that you need to understand the nature of mean, mean simply sum up all the observation and then divide it by number of observation.
MeanR=x1+x2+x3……..x541/541 (FOR SET-A)
MeanP=y1+y2+y3……y541/541 (FOR SET-B) Now let’s say unfortunately one person could not recover from corona and died, now for him, the recovery time will be infinite.
Mean for that person will be Infinite as we are just taking the sum of observations. So for this reason Median Proved to be one of the good metric. There also could be other metrics or test statistics for this problem.
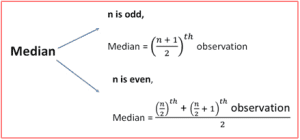
Now as you can see above, Median is ((n+1)/2)Th observation when n is odd, here n is the number of observations.
For example- a=[1,2,3,4,5], median would be ((5+1)/ 2)Th observation means (3rd observation) which is 3, median for a is 3
By same approach we can find median for even number of observations.
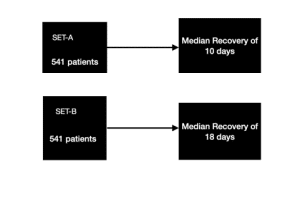
Now what they have found is that Median for SET-A is 10 days, means on average people who were given Remdesivir were recovered in 10 days.
Median for Set-B is 18 days, means on average people who were given placebo were recovered in 18 days.
Now There could be one conclusion that, the median time for Remdesivir is less means it’s actually working on human body and reducing the time of recovery in humans.
But the answer will be “NO”. Because just by this small sample size we can’t conclude that Remdesivir will be effective for the whole population, if samples goes here and there, this result could easily be tampered. NOW WHAT TO DO THEN???
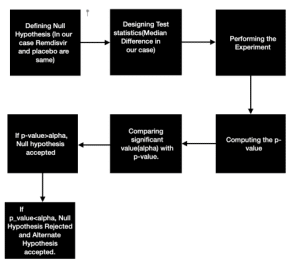
There could be multiple tests for solving this problem but one common technique is Hypothesis Testing. Let’s Understand the basic intuition of Hypothesis Testing.
There are basically 4 parts of Hypothesis testing-: • Defining Null Hypothesis.
- Designing Test Statistics.
- Experiment.
- Computing the p-value.
I will take same running example of Remdisvir to make you understand Hypothesis Testing. Lets Understand what is Null Hypothesis, In our running example we can say that Null Hypothesis is “There is No Difference in Population Median, means Remdisvir and placebo have almost same recovery time and remdisvir is not helping the patients to recover fast.”
The Null hypothesis is a typical statistical theory which suggests that no statistical relationship and significance exists in a set of given single observed variable, between two sets of observed data and measured phenomena.
Counter to this we have something called Alternative Hypothesis, In our case the alternate hypothesis will be “Remdesivir and Placebo are different and Remdesivir is shortening the time of the recovery of covid-19 patients”
For Free, Demo classes Call: 8983120543
Registration Link: Click Here!
Now the process is very straightforward-
Lets discuss every piece of this big puzzle one by one…
1. Defining the NULL HYPOTHESIS (Denoted by Ho)
Lets define our Null Hypothesis once again. “There is No Difference in Population Median, means Remdisvir and placebo have almost same recovery time or in simple terms remdisvir and placebo have same distributions and remdisvir is not helping the patients to recover fast.”
So we are assuming that there is no difference between Remdisvir and Placebo.

2. Designing the Test Statistics
To check whether Remdesivir and Placebo have same distribution or not, we need a metric/formula, In our case Median difference between Remdesivir and Placebo(which we saw earlier) is our test Statistics. Let’s say ( Mr ) is the Median of Remdesivir and (Mp) is the median of Placebo and our test Statistics is the difference between Mr and Mp,
Test statistics=|Mr-Mp|
Lets say from our observations we found the Mr(Median of Remdesivir observation) to be 8 days and Mp(Median of Placebo observations) to be 15 days and the difference comes out to be 7 days.
3. The P-value
Let’s Understand the meaning of p-value,
P(x=7|Ho) this is how you write p value. P(x=7|Ho) means what is the probability of observing a sample median difference of 7 days with a sample size of 541 people if null hypothesis is TRUE.
Here Ho(Null Hypothesis) is, “ Distributions of Set A and Set-B are same”
Or we can say, it is the probability of observing a difference of 7 days in Medians between SET A(Remdesivir) and SET-B(Placebo) if there is no population difference in median days.
When i say “If there is no population difference in median heights”, it simply means that i am talking about Null hypothesis.
Computing p-value is itself needs a different blog, I will cover that later but for now lets see we have computed p-value for the same.
4. Comparing p value with significance value Lets understand significance value(alpha) which is generally taken as 5%,
CASE-1
If P(x=7|Ho)=0.2 → it means there is 20% chance of observing a difference of 7 days when there is no population median difference.
p-value > alpha(5%), means Ho is accepted, means we will say that there has not been significant proof which tells us that Remdesivir is better than placebo in reducing recovery time of patient.
CASE-2
If P(x=7|Ho)=0.03→ it means there is 3% chance of observing a difference of 7 days when there is no population median difference.
p-value <alpha(5%), means Ho is rejected the Ha(Alternative Hypothesis) is accepted means we
will say that there has been significant proof which tells us that Remdesivir is better than placebo in reducing recovery time of patient.
And that’s how this test will end.
There could be multiple tests like this which were performed by National Institute , Hypothesis Testing is one of them.
For Free, Demo classes Call: 8983120543
Registration Link: Click Here!
There is an another Interesting topic which we will cover in future blogs called Confidence Interval. That’s it for now, Thank you for reading.
Author:-
Nishesh Gogia
Call the Trainer and Book your free demo Class for JAVA now!!!
© Copyright 2021 | Sevenmentor Pvt Ltd.