About Tableau
In the era of big data, data visualization has emerged as a powerful method to uncover patterns, track performance metrics, and make informed decisions. Tableau, a leading platform for data visualization and business intelligence, enables users to convert raw data into interactive dashboards and rich graphical insights with minimal effort. As companies prioritize data-driven strategies, proficiency in Tableau is becoming indispensable across industries. This makes Tableau Classes in Parel a sought-after educational pathway for professionals, analysts, and aspiring data enthusiasts who want to gain mastery over business analytics and interactive reporting.
Parel, a prominent educational and commercial hub in Mumbai, offers a conducive environment for technical upskilling. With its strong presence of IT parks, fintech companies, and digital consulting firms, the locality attracts a large segment of learners who wish to specialize in analytics tools. Tableau Course in Parel is meticulously designed for individuals who want to understand and harness the power of data visualization to support corporate decision-making, strategic planning, and operational insights. With the growing need for intuitive, interactive, and scalable dashboards, Tableau expertise is no longer a niche—it’s a necessity.
What sets Tableau Training in Mumbai apart is its emphasis on hands-on implementation, real-time analytics, and domain-relevant scenarios. Learners engage with datasets from diverse sectors—such as retail, banking, healthcare, logistics, and e-commerce—to build customized visualizations that offer clarity, context, and actionable information. The training methodology is rooted in interactive sessions, tool-based learning, and exposure to live Tableau dashboards, enabling learners to directly translate their knowledge into practical applications. Whether it's generating sales trend reports, monitoring KPIs, or visualizing survey data, the training modules empower learners to think in terms of visual storytelling and data strategy.
The Tableau Classes in Parel cater to professionals from diverse backgrounds—be it finance, marketing, operations, HR, or IT. The focus is on bridging the gap between data literacy and business intelligence by making the tool accessible, adaptable, and intuitive. Learners are not just taught how to create charts but how to use Tableau’s features—such as calculated fields, filters, parameters, and dashboards—to answer business questions and influence decision-makers. This approach makes the classes highly applicable across roles and industries, where speed, accuracy, and visual clarity in reporting are paramount.
Another key strength of the Tableau Course in Parel is its alignment with industry demands and visualization standards. Businesses are increasingly relying on Tableau dashboards for real-time monitoring, forecasting, and strategic reviews. The classes ensure learners become proficient in designing dashboards that are not only visually appealing but also structured, dynamic, and interactive. These dashboards often include features like drill-down paths, story points, user filters, and automated data refreshes—enabling stakeholders to explore data from multiple perspectives and arrive at insights faster.
Parel’s strategic location offers access to expert faculty and industry veterans who bring practical experience into the training room. Instructors typically have hands-on exposure to Tableau deployments across various sectors, which they use to guide students on best practices, common pitfalls, and optimization techniques. These real-world insights form an essential component of Tableau Training in Parel, offering learners the advantage of applied learning. Moreover, the institutes here promote project-based learning, where learners work on simulated business problems and data visualization challenges that mimic enterprise scenarios.
A critical aspect of Tableau Classes in Bombay is their focus on self-service analytics. With businesses striving to democratize data usage, Tableau enables business users to explore data independently without over-reliance on IT teams. The training equips learners to adopt this self-service model by teaching them how to connect various data sources, clean and transform data within Tableau, and create responsive dashboards that update automatically. As organizations demand more agile and real-time insights, these skills are proving crucial for performance monitoring and continuous improvement initiatives.
The training ecosystem in Parel is also known for its emphasis on analytics thinking and data storytelling. It’s not just about building dashboards—it’s about using them to tell meaningful stories supported by trends, patterns, and forecasts. Learners are trained to combine data from different sources, highlight key metrics, and structure dashboards to guide users logically through the narrative. This transforms static reports into strategic tools that drive clarity and alignment in business meetings, board reviews, and departmental analyses.
Institutes offering Tableau Course in Parel also encourage learners to practice with industry-relevant datasets—ranging from CRM and ERP data to social media analytics and supply chain statistics. These datasets mimic the volume, variety, and velocity of data encountered in modern organizations, preparing learners for real-time applications. The training also includes exposure to Tableau’s ecosystem—such as Tableau Public, Tableau Server, Tableau Online, and Tableau Prep—ensuring learners understand how to deploy their dashboards across teams and maintain secure, collaborative data environments.
A defining characteristic of Tableau Training in Parel is its accessibility to both beginners and experienced professionals. The training is structured to accommodate learners from various academic and professional backgrounds, helping them grasp technical visualization concepts at a pace suited to their learning style. Institutes provide flexible batch timings, continuous mentoring, performance assessments, and learning support to make the training as inclusive and effective as possible. This personalized attention helps learners not only complete the course but also build confidence in applying Tableau in their professional contexts.
Another strength of Tableau Classes in Parel is the emphasis on performance optimization and usability. Learners are trained to design dashboards that are responsive, load quickly, and adapt to different screen sizes and user roles. They also understand the importance of color theory, chart selection, font usage, and layout principles—making their dashboards more intuitive, digestible, and aesthetically balanced. This design-oriented approach ensures that learners go beyond functionality and build visualizations that enhance user engagement and data comprehension.
The training centers in Parel are often equipped with high-tech labs, cloud-based Tableau access, and collaborative tools that support interactive learning. Learners can practice dashboard building, dataset manipulation, and publishing routines outside the classroom environment, enabling a seamless transition from learning to implementation. Institutes also organize hackathons, dashboard competitions, and visualization challenges to keep learners motivated and competitive. These experiences help learners develop agility, creative thinking, and business acumen—all of which are vital in dynamic analytics roles.
Furthermore, Tableau Course in Parel places a strong emphasis on data ethics, governance, and compliance. As data privacy regulations tighten and organizations implement strict governance frameworks, learners are trained to follow ethical standards in data visualization. They understand how to build transparent, accurate, and auditable dashboards that respect data security protocols and organizational hierarchies. This awareness ensures that learners are not just skilled users of Tableau but responsible custodians of business data.
The academic culture in Parel also fosters a habit of continuous learning and experimentation. Tableau as a platform evolves constantly—with regular updates, new features, and enhanced integration capabilities. Institutes offering Tableau Training in Parel keep their content up-to-date and equip learners to stay ahead of the curve. Whether it’s exploring new chart types, using Tableau Extensions, integrating with Python/R, or connecting to cloud services like Google BigQuery and Snowflake, the training encourages a spirit of exploration and innovation.
The peer learning environment also contributes significantly to the success of learners. By interacting with fellow data enthusiasts from various sectors, learners gain fresh perspectives, share use cases, and explore alternate problem-solving methods. Institutes often provide access to online forums, community groups, and alumni networks where learners can exchange knowledge, find mentors, and stay updated with industry trends. This ongoing community support enhances retention, career guidance, and long-term Tableau proficiency.
Finally, the Tableau Classes in Parel are distinguished by their outcome-oriented approach. The focus is not only on completing the training but on ensuring learners can apply Tableau in real-world scenarios effectively. Trainers provide post-course project mentoring, visualization audits, and personalized dashboard reviews to help learners polish their final deliverables. This quality assurance ensures that students leave the course not just with a certificate, but with a tangible portfolio and confidence in their Tableau skills.
Online Classes
For those unable to attend physical classes, the Online Tableau Course in Parel offers a flexible and immersive learning experience through live virtual sessions, recorded modules, and hands-on lab access. Learners benefit from remote access to Tableau software, real-time query resolution, and collaborative discussion forums. With interactive projects, instructor-guided tutorials, and peer networking opportunities, the online course allows working professionals and students to learn Tableau from the comfort of their location while still enjoying the structure and discipline of classroom training.
Corporate Training
Organizations looking to upskill their analytics teams can take advantage of Corporate Tableau Training in Parel, which is tailored to enterprise needs. These programs offer customized content aligned with business objectives, data ecosystems, and reporting standards. Delivered on-site or virtually, the training focuses on real-time dashboards, process KPIs, and collaborative visualization techniques suited for departments like sales, finance, operations, or HR. By aligning Tableau capabilities with internal data strategies, the corporate training drives faster insights, improved decision-making, and cross-functional data fluency.
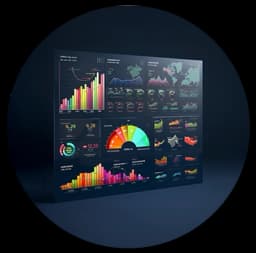
 Tableau is a visual analytics tool for analysing data and solving problems.
 Used by businesses in marketing, sales, and customer satisfaction.
 Tableau is easy to understand and does not require specific training or coding knowledge.